Waiting to Get Your Dissertation Accepted?
Last Updated on: 3rd February 2024, 01:28 am
Among several quantitative research alternatives is the experimental method. Experimentation is a very rigorous technique to control the conditions during data collection. This is a requirement when the objective is to determine cause and effect.
Experimentation is suitable for dissertations and theses, and used quite often to investigate real-world problems.
There are principles of experimentation that can be applied to all quantitative research methods—even when we are only interested in correlation between variables or simply performing comparative or descriptive analysis.
In this article, I will describe the principles of experimentation, explain when and how they are used, and discuss how experiments are planned and executed.
What is Design of Experiments?
The science of experimentation was formalized about 100 years ago in England by R. A. Fisher. The principles are captured in the term, design of experiments—often called DOE or experimental design.

The central idea is to carefully and logically plan and execute data collection and analysis to control the factors that are hypothesized to influence a measurable outcome. The outcome or response is a numerical assessment of behavior or performance.
Renowned statistician George Box said, “All experiments are designed experiments — some are poorly designed, some are well-designed.”
So, the intent of experimental design is to design experiments properly so we can reliably assess the influence that the control factors have on the outcome. The techniques have been proven, mathematically, to be more effective (accurate) in identifying influential factors and their impact. And, the techniques yield the most efficient use of resources for that task.
Variables – Definitions
Response variables are the measures of performance, behavior, or attributes of a system, process, population, group, or activity. They are objective, measurable, and quantitative. They represent the result or outcome of a process. For example: academic test scores.
Control factors include conditions that might influence performance, behavior, or attributes of a process, system, or activity. They can be either controlled or measured. These might include, for example, environmental conditions (day/night, weather); operational conditions (school, curriculum).
An Example
Let’s say we wish to analyze the impact that a new arithmetic curriculum has on elementary students, compared to the curriculum currently in use. The outcome (or response) is measured using a diagnostic test (comparing it to a pre-test or a control group). So, one control factor is type of curriculum.
But, we also postulate that two other factors, gender and school, may be influential. We plan an experiment to control the three factors: curriculum (CUR), school (SCH), and gender (GDR). Let’s say for the sake of illustrating the concepts that there are two versions of the curriculum (old and new), two schools, and two genders (male and female).
We’ll carry this example through the article.
Over 50% of doctoral candidates don’t finish their dissertations.

Factorial Experiments
The purest form of a controlled, designed experiment is the factorial experiment.
A factorial experiment varies all of the control factors together instead of one at a time or some other scheme. A full factorial design investigates all combinations of factor levels.
Factorial designs provide the most efficient and effective method of assessing the influence of control factors across the entire factor space. The influence is assessed using analysis of variance (ANOVA).
In our example, the experiment has three control factors (CUR, SCH, and GDR), at two levels each. The matrix of control factors and their levels is illustrated in this table:
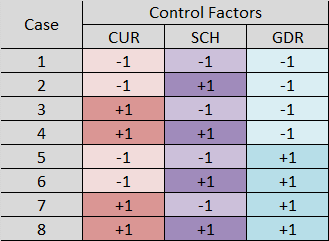
We use here a form of coding called effects coding. We represent two-level factors with +1 and -1. When there are factors with more levels, effects coding can employ other numbers, as long as the codes for any factor sum to zero. We will save the discussion on factor coding for another article.
We can see that in our experiment, there are 2 x 2 x 2 = 23 = 8 combinations of factor levels. The table represents those combinations as 8 cases.
It is likely that we would need more sample size than 8. Sample size enables the following:
- Adequate precision (effect size).
- Adequate statistical power (the inverse of the probability of a Type II or false negative statistical error).
- Adequate statistical confidence (the inverse of the probability of a Type I or false positive statistical error).
To get more sample size, we simply replicate (i.e., repeat) the cases. That is, we sample multiples of each case as shown here (replication of 2):
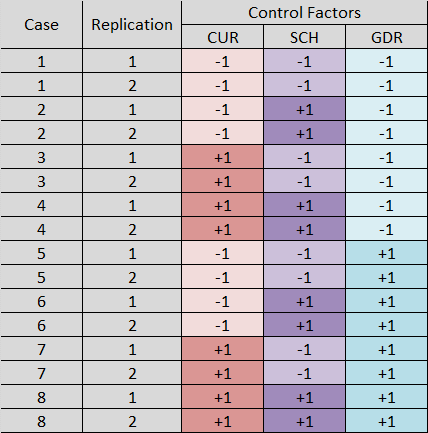
The sample size needed, and hence the replication of cases, is computed using an app such as G*Power (Faul et al. 2009). In this example, we have 8 cases, replicated twice, for a sample size of 16.
Fractional Factorial Designs
Sometimes it is not possible to run all possible combinations of factor levels (perhaps insufficient resources to execute a full factorial with replication). As an alternative, we can use a mathematically derived subset of the entire set of combinations of the full factorial, called a fractional factorial.
For example, if instead of our full factorial, we employ a logically derived subset of the original 8 cases as highlighted here, and replicate these 4 cases (a half fractional factorial):
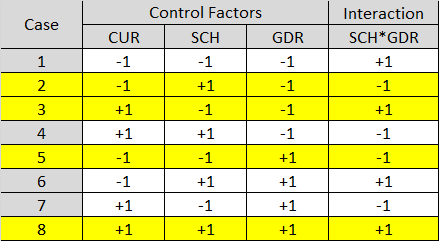
The cases are chosen by aliasing or confounding a two-factor interaction (SCH*GDR) with the control factor, CUR. The assumption is that the two-factor interaction SCH*GDR is not meaningful. So, the interaction is confounded with CUR and its effects are not distinguishable from the effects of CUR.
With proper sample size, a fractional factorial is capable of identifying significant main effects and interactions.
Major Principles of Experimental Design
The major principles of experimental design include the following:
- Quantitative, measurable response variables—outputs of a process or system.
- Precision when measuring response variables.
- Control factors and independent variables—inputs to a process or system.
- A real-world process tested with an instrument (a test, observation, or simulation experiment using a model of the real system or process).
- Designed experiments—controlling the factors and measuring the associated variation in the response variables.
- Factorial or fractional factorial designs—assessing all combinations/cases.
- Orthogonality among levels of the control factors.
- Power analysis (sample size calculations based on effect size, statistical confidence, and statistical power).
- Replication of cases to achieve minimum required sample size.
- Random selection of cases (combinations of control factors and their levels).
Even in quasi- or non-experimental designs, many of these principles can and should be applied when planning and conducting research and analysis. For example, a non-experimental comparative study using a questionnaire should incorporate these attributes:
- A quantitative, measurable response variable informed by the average score on a subset of the questions.
- A control over the participant demographics achieved with stratified sampling.
- A factorial design assessing all combinations of demographics (cases).
- Power analysis (calculating sample size based on effect size, confidence, and power).
- Replication of cases to achieve minimum required sample size.
- Random selection of cases within each stratum.
What Experimental Design Contributes

Experimental design was developed to assess the influence that predictors have on response variables (system outputs). That is, to facilitate a mathematically rigorous assessment of how a change in inputs results in a corresponding change in outputs.
The essential idea behind a designed experiment is control—to purposefully manipulate the values or levels of the control factors in order to measure the corresponding change in response variables. This is done in a way that mathematically associates the change in system performance within controlled, measurable conditions.
In some analyses, it may be desirable or necessary to allow some predictors to vary, randomly, within a range; instead of setting fixed values. In this case, though there is an impact on statistical power and confidence, at the very least these control factors are measured as precisely as possible so that their variation can be associated with variation in the response variable. In this situation, multiple linear regression is the analysis tool.
Experimental design permits us to accomplish these objectives reliably:
- Characterize the sensitivity of response variables to changes in the predictors.
- Determine which predictors are clearly influential.
- Identify which predictors are clearly not significant, then reduce the number of cases to analyze.
- Identify interactions between control factors.
- Identify factors that are not significant individually, but moderators of other predictors.
- Predict system performance or behavior.
- Identify key cases for subject matter expert interpretation.
- Use the same control factors and common response variables during separate analyses and using different research designs and methods.
- Combine or compare performance and behavior across research designs and methods.
Experimental Design and Analysis Considerations
Any experiment or analysis should be planned to address a research problem, purpose, and research question. Planning should not only respond to the fundamental objectives of the research, but also account for resource limitations, such as
- Time.
- Capacity (for example, human effort and computer resources).
- Competing demands for the resources (money).
Therefore, it is essential to
- Prioritize the use of scarce resources.
- Use efficient methodologies (experimental designs and analytical methods).
- Seek no more precision than is needed to answer a question or meet an analytical objective.
An experimental design and analytical method are chosen that, within the resource constraints, offer the greatest potential to address the analytical objective that motivated the experiment. There will be tradeoffs among competing attributes of various designs (e.g., trading statistical precision against sample size).
The following are some considerations for choosing a design that answers questions adequately, maximizes efficiency, and makes appropriate tradeoffs in experimental attributes.
Sequential Experimentation

Sequential experimentation involves a linked series of experiments:
- Building on what is learned through analysis in the previous experiment.
- Refining understanding of the system or process—the significant and non-significant explanatory factors.
- Reducing factor space based on analysis-based factor screening—smaller, more focused, more efficient follow-on experiments.
- Refining and re-focusing analytical objectives, methodologies, and statistical tests.
- Investigating specific cases where performance or behavior is unexpected or interesting.
- Using data previously collected and analyzed to inform future experiments.
- Computing variance in response variables that aids in performing sample size calculations for subsequent experiments.
Orthogonality
In an orthogonal design (as in a factorial experiment), the main effect of each control factor can be estimated independently without confounding the effect of one control factor by another.
In other words, the estimated effect of one control factor will not interfere with the estimated effect of another control factor.
The importance of orthogonal designs is their capability to minimize the effects of collinearity. A confident estimate of control factor effects leads to understanding the true system performance.
Factor Interactions
Factorial designs enable the experimenter to investigate not only the individual effects (or influence) of each control factor (main effects) but the interaction of control factors with each other.
A two-factor interaction means this: The effect that a control factor has on the response depends on the value of a second control factor. For example . . . the influence of one predictor (say, CUR) on the response (Y = test scores) depends on the value of another predictor (say, SCH). The relationship between CUR and Y (the slope or coefficient) changes depending on the value of SCH.
A two-factor interaction represents a qualification on any claim that one control factor influences the response. Some of the most important insights are gleaned from two-factor interactions.
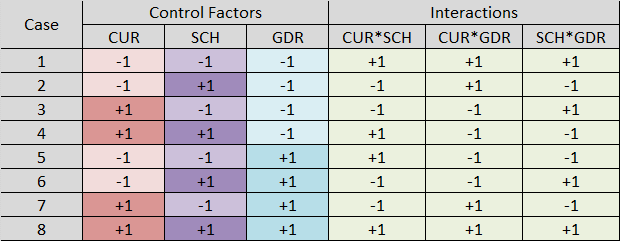
A two-factor interaction is calculated as the product of its two control factors, as shown in this table:
Two-factor interactions are evaluated in ANOVA just as if they were individual predictors.
The conclusions about the significance and magnitude of relationships between control factors and the response variable must include a discussion of the significant two-factor interactions.
Factor Aliasing
Aliasing in a test matrix occurs when the levels for a control factor are correlated with another control factor. This causes the main effects (influence of individual control factors) to be confounded (i.e., the effects cannot be estimated separately from one another).
The alias structure of an experiment matrix characterizes the confounding within the experimental design and can be evaluated using software applications (e.g., SPSS). The alias matrix describes the degree to which the control factors are confounded with one another. A rule of thumb in complex designs is that control factors whose aliasing is less than |0.7| can be evaluated in the model. If the aliasing is greater than |0.7|, one of the control factors should be considered for removal from the analysis; or the control factors should be combined.
Factorial designs avoid problems with factor aliasing. The issue is most prevalent in fractional factorials.
Pseudo-factorial Designs
ANOVA and factorial designs go hand in hand because the predictors (control factors) are categorical variables, suitable for controlling and readily analyzed using ANOVA. The advantage of a factorial design is that it is capable, with high power and confidence, of detecting the influence of control factors on the response, with an efficient use of resources. Another advantage is the ability to calculate and evaluate interactions between control factors.

There are some disadvantages of factorial designs:
- Nonlinearities between the points defined by the control factor levels may not be detected
- The control factor levels may be set at a relatively small number of discrete points.
- The design may not provide a detailed understanding of performance throughout the factor space (i.e., between points).
- Some control factors may not be controllable (e.g., air temperature and pressure).
In these kinds of experiments, ANOVA and pure factorial experiments may not be the best option.

An alternative is a pseudo-factorial experiment. This approach allows some latitude in the values of some of the predictors, while preserving some of the principles of factorial experiments. These designs are built around a factorial experiment in which the quantitative predictors are allowed to vary randomly within an operational range. Those ranges are controlled as if they were categorical.
Final Thoughts
An experiment is a powerful research design for assessing the influence of factors on the performance or behavior of systems, activities, and other phenomena. Proper experimental design is essential when assessing cause and effect. But, the principles of experimental design are also desirable attributes in many if not most quantitative research and analysis.
References
- Aczel, A. D., & Sounderpandian, J. (2006). Complete business statistics (6th ed.). McGraw-Hill/Irwin.
- Faul, F., Erdfelder, E., Buchner, A., & Lang, A. G. (2009). Statistical power analyses using G*Power 3.1: Tests for correlation and regression analyses. Behavior Research Methods, 41, 1149-1160. https://link.springer.com/article/10.3758/BRM.41.4.1149
- Levine, D. M., Berenson, M. L., Krehbiel, T. C., & Stephan, D. F. (2011). Statistics for managers using MS Excel. Prentice Hall/Pearson.
- McAllister, B. (2023). Simulation-based performance assessment. Kindle.
- Montgomery, D. C. (2019). Design and analysis of experiments. Wiley.
- Nicolis, G. & Nicolis, C. (2009). Foundations of complex systems. European Review, 17(2), 237-248. https://doi.org/10.1017/S1062798709000738
- Snedecor, G. W. & Cochran, W. G. (1973). Statistical methods (6th ed.). The Iowa State University Press.
- Warner, R. M. (2013). Applied statistics: From bivariate through multivariate techniques. Sage.